Showing data with charts is appealing and needed in a variety of apps. The Qt Charts module makes this super easy and comfortable.
Check out the documentation for a full list of features and available chart types: Qt Charts QML Types
The following example shows a simple pie chart.
 import Felgo
 import QtQuick
 import QtCharts

 App {

   NavigationStack {

     AppPage {
       title: "Charts"

       ChartView {
         width: parent.width
         height: dp(300)
         theme: ChartView.ChartThemeBrownSand
         antialiasing: true

         PieSeries {
           id: pieSeries
           PieSlice { label: "eaten"; value: 94.9 }
           PieSlice { label: "not yet eaten"; value: 5.1 }
         }
       }
     }
   }
 }
Animating a chart is super easy. All you have to do is animate the displayed values and the chart will animate smoothly. In the following example, we use the Behavior type, to animate any change on the value used in the chart.
 import Felgo
 import QtQuick
 import QtCharts

 App {

   NavigationStack {

     AppPage {
       title: "Animated Chart"

       ChartView {
         id: chart
         width: parent.width
         height: dp(300)
         theme: ChartView.ChartThemeBrownSand
         antialiasing: true
         // This is the value we use to create our pie slices
         property real eaten: 95
         // With the Behavior, we can animate any change in the eaten value
         Behavior on eaten {
           NumberAnimation {
             duration: 500
             easing.type: Easing.InOutQuad
           }
         }

         PieSeries {
           id: pieSeries
           // The first slice displays the eaten value
           PieSlice {
             label: "eaten"
             value: chart.eaten
           }
           // The second slice displays the rest
           PieSlice {
             label: "not yet eaten"
             value: 100-chart.eaten
           }
         }

         AppButton {
           anchors.horizontalCenter: parent.horizontalCenter
           anchors.top: chart.bottom
           text: "Toggle"
           onClicked: {
             // We toggle the eaten value between 95 and 5
             chart.eaten = chart.eaten == 95 ? 5 : 95
           }
         }
       }
     }
   }
 }

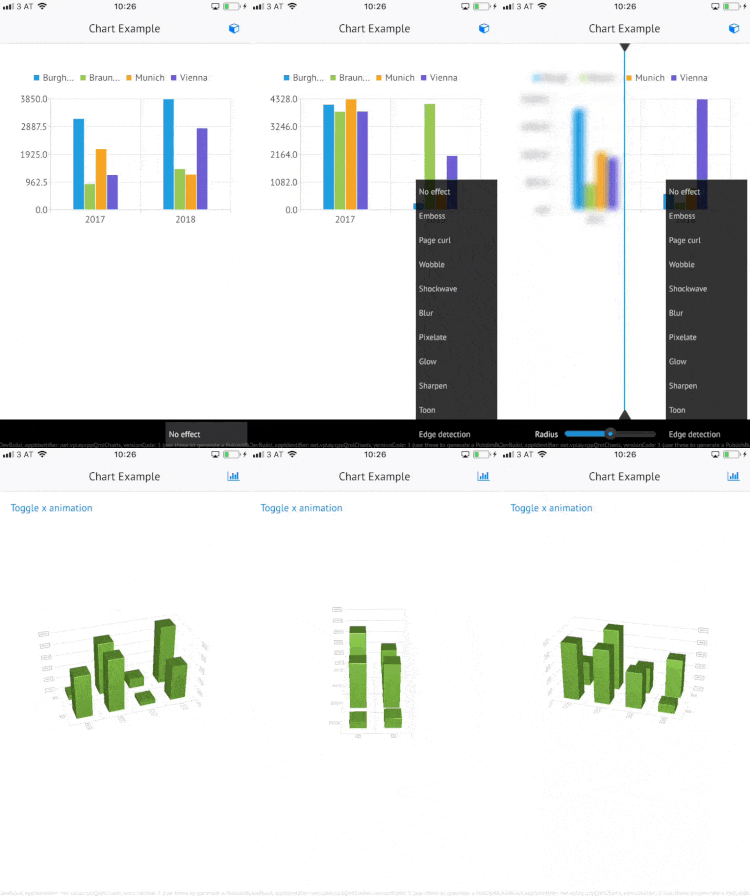
You can find an example app that uses a C++ model to show 2D and 3D charts here: C++ Backend Charts Demo App

As part of the free Business evaluation, we offer a free welcome call for companies, to talk about your requirements, and how the Felgo SDK & Services can help you. Just sign up and schedule your call.
Sign up now to start your free Business evaluation:

