SplineSeries
Presents data as spline charts. More...
Properties
Detailed Description
A spline series stores the data points and the segment control points needed by QPainterPath to draw a spline. The control points are automatically calculated when the data changes. The
algorithm computes the points so that the normal spline can be drawn.
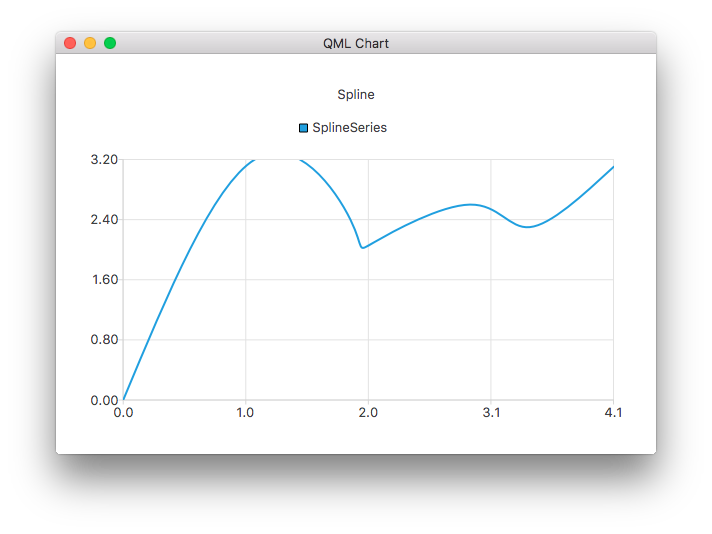
The following QML code shows how to create a simple spline chart:
ChartView {
    title: "Spline Chart"
    anchors.fill: parent
    antialiasing: true

    SplineSeries {
        name: "Spline"
        XYPoint { x: 0; y: 0.0 }
        XYPoint { x: 1.1; y: 3.2 }
        XYPoint { x: 1.9; y: 2.4 }
        XYPoint { x: 2.1; y: 2.1 }
        XYPoint { x: 2.9; y: 2.6 }
        XYPoint { x: 3.4; y: 2.3 }
        XYPoint { x: 4.1; y: 3.1 }
    }
}
Property Documentation
|
capStyle : Qt::PenCapStyle
|
The number of data points in the series.
The width of the line. By default, the width is 2.0.


