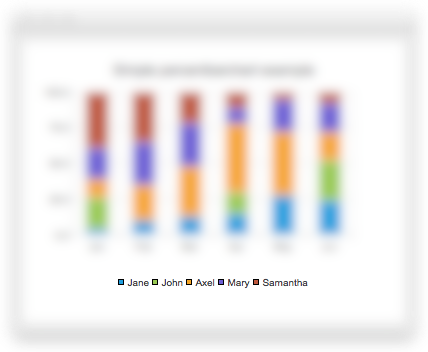
Displays the legend of a chart. More...
| Import Statement: | import QtCharts 2.2 |
| Instantiates: | QLegend |
A legend is a graphical object that displays the legend of a chart. The legend state is updated by the ChartView type when series change. The Legend type properties can be attached to the ChartView type. For example:
ChartView {
    legend.visible: true
    legend.alignment: Qt.AlignBottom
    // Add a few series...
}

Note: There is no QML API available for modifying legend markers. Markers can be modified by creating a custom legend, as illustrated by Qml Custom Example.
Defines how the legend is aligned with the chart. Can be Qt.AlignLeft, Qt.AlignRight, Qt.AlignBottom, or Qt.AlignTop. If you set more than one flag, the result is undefined.
|
backgroundVisible : bool |
Whether the legend background is visible.
|
borderColor : color |
The line color of the legend.
|
color : color |
The background (brush) color of the legend.
|
labelColor : color |
The color of the brush used to draw labels.
|
markerShape : enumeration |
The default shape of the legend markers. The default value is MarkerShapeRectangle.
| Constant | Description |
|---|---|
Legend.MarkerShapeRectangle |
Legend markers are rectangular |
Legend.MarkerShapeCircle |
Legend markers are circular |
Legend.MarkerShapeFromSeries |
Legend marker shape is determined by the series |
This QML property was introduced in Qt 5.9.
See also QLegend::MarkerShape.
|
reverseMarkers : bool |
Whether reverse order is used for the markers in the legend. This property is false by default.
|
showToolTips : bool |
Whether tooltips are shown when the text is truncated. This property is false by default. This property currently has no effect as there is no support for tooltips in QML.
|
visible : bool |
Whether the legend is visible.
By default, this property is true.
See also QGraphicsObject::visible.