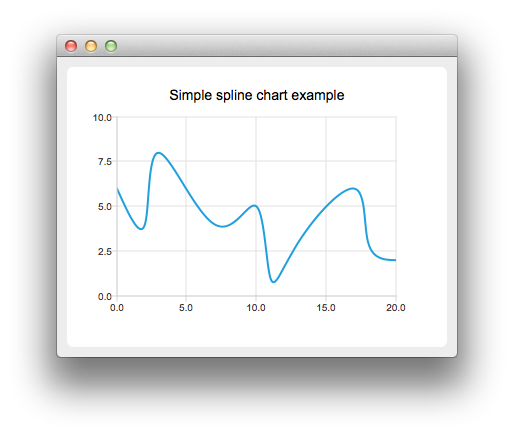
The example shows how to create a simple spline chart.

To run the example from Qt Creator, open the Welcome mode and select the example from Examples. For more information, visit Building and Running an Example.
To create spline charts we need to put our data into QSplineSeries. QSplineSeries automatically calculates spline segment control points that are needed to properly draw the spline.
QSplineSeries *series = new QSplineSeries();
series->setName("spline");
Now let's add some data points to the series.
series->append(0, 6);
series->append(2, 4);
series->append(3, 8);
series->append(7, 4);
series->append(10, 5);
*series << QPointF(11, 1) << QPointF(13, 3) << QPointF(17, 6) << QPointF(18, 3) << QPointF(20, 2);
The data series has been populated. To display it on a chart we create a QChart object and add the data series to it. We also set the title and the values range on the y-axis, so that our chart's visibility is better.
QChart *chart = new QChart();
chart->legend()->hide();
chart->addSeries(series);
chart->setTitle("Simple spline chart example");
chart->createDefaultAxes();
chart->axisY()->setRange(0, 10);
Then we create a QChartView object with QChart as a parameter. This way we don't need to create a QGraphicsView scene ourselves. We also set the Antialiasing on to have the rendered lines look nicer.
QChartView *chartView = new QChartView(chart);
chartView->setRenderHint(QPainter::Antialiasing);
Finally, we set the QChartView as the windows's central widget.
QMainWindow window;
window.setCentralWidget(chartView);
window.resize(400, 300);
window.show();
Files:

As part of the free Business evaluation, we offer a free welcome call for companies, to talk about your requirements, and how the Felgo SDK & Services can help you. Just sign up and schedule your call.
Sign up now to start your free Business evaluation:

