LineSeries
Presents data in line graphs. More...
Properties
Signals
Detailed Description
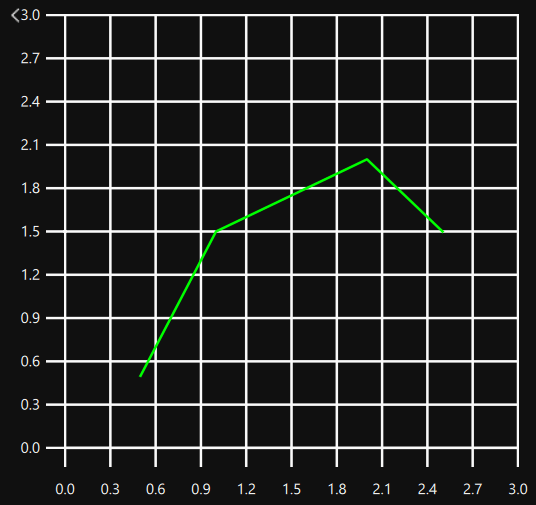
A line graph is used to show information as a series of data points connected by straight lines.
LineSeries uses mostly the same API as ScatterSeries so see ScatterSeries documentation for further usage examples.
See also ScatterSeries.
Property Documentation
|
capStyle : Qt::PenCapStyle
|
Marks the point with the given QML component.
pointDelegate: Image {
    source: "images/happy_box.png"
}
The width of the line. By default, the width is 2.0. Widths lower than 0 are invalid and are automatically set to 0.
Signal Documentation
This signal is emitted when the line series cap style changes.
Note: The corresponding handler is onCapStyleChanged.
This signal is emitted when the line series width changes.
Note: The corresponding handler is onWidthChanged.


