Using Logarithmic Value Axes
Create a QLineSeries instance and add some data to it.
auto series = new QLineSeries;
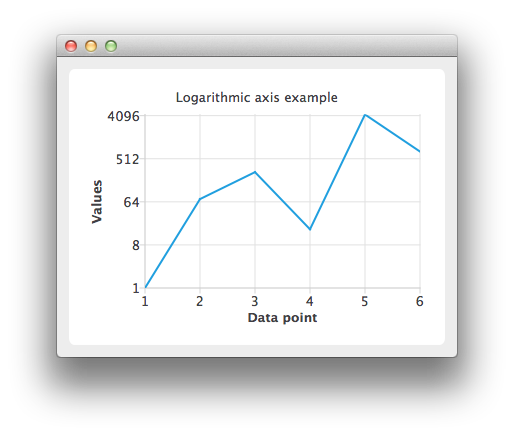
*series << QPointF(1.0, 1.0) << QPointF(2.0, 73.0) << QPointF(3.0, 268.0) << QPointF(4.0, 17.0)
<< QPointF(5.0, 4325.0) << QPointF(6.0, 723.0);
To present the data on the chart we need a QChart instance. Add the series to it, hide the legend and set the title of the chart.
auto chart = new QChart;
chart->addSeries(series);
chart->legend()->hide();
chart->setTitle("Logarithmic Axis");
Create the axes. Add them to the chart and attach to the series.
auto axisX = new QValueAxis;
axisX->setTitleText("Data point");
axisX->setLabelFormat("%i");
axisX->setTickCount(series->count());
chart->addAxis(axisX, Qt::AlignBottom);
series->attachAxis(axisX);

auto axisY = new QLogValueAxis;
axisY->setTitleText("Values");
axisY->setLabelFormat("%g");
axisY->setBase(8.0);
axisY->setMinorTickCount(-1);
chart->addAxis(axisY, Qt::AlignLeft);
series->attachAxis(axisY);
Then create a QChartView object with QChart as a parameter.
createDefaultChartView(chart);
The chart is ready to be shown.


